Statistics 7a: Mastery Questions |
| Guidance Notes - To answer each question, click on the letter that corresponds to the correct answer. You then need to click the 'Check' button to see if you are correct.
If your answer is incorrect, you will be given a hint on how to get the correct answer. You then need to click the 'Try again' button to attempt the question once more. |
| 1. |
Look at this pictogram.
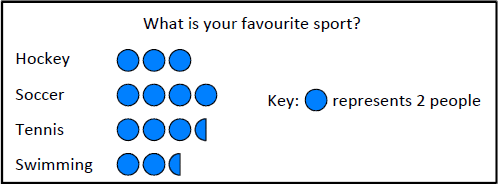
Which of the following statements is incorrect?
Incorrect. Hint - Each blue dot is two people. Half a blue dot is one person. You should now be able to work out the number of people that chose each sport.
|
| 2. |
This pie chart shows the distribution of fruit trees in an orchard.
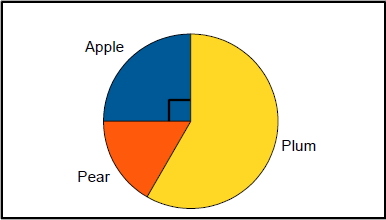
48 trees were planted.
| If | 1 | of them are pear trees, how many plum trees are there? |
 |
| 6 |
Incorrect. Hint - Work out how many apple trees and pear trees were planted first.
|
| 3. |
This bar chart shows the number of cars by colour in the car park yesterday.
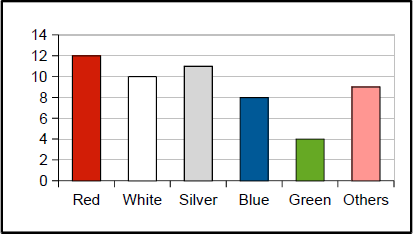
How many cars were in the car park?
Incorrect. Hint - Work out how many cars of each colour were in the car park. For example, there were 12 red, 10 white, 11 silver …
|
| 4. |
Look at this dotplot showing the scores in a geography quiz.
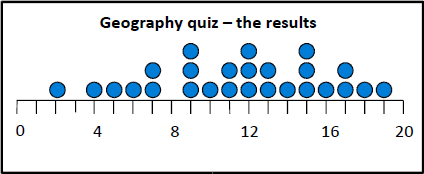
How many pupils entered the quiz?
Incorrect. Hint - Look at page 12 in Statistics 7a unit.
|
| 5. |
Look at this stem and leaf plot.
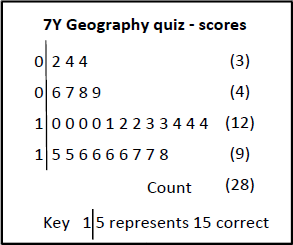
What is the difference between the highest and the lowest scores?
Incorrect. Hint - Look at page 15 in Statistics 7a unit.
|
| 6. |
This stacked bar chart shows the sales of tickets for 3 cricket matches.
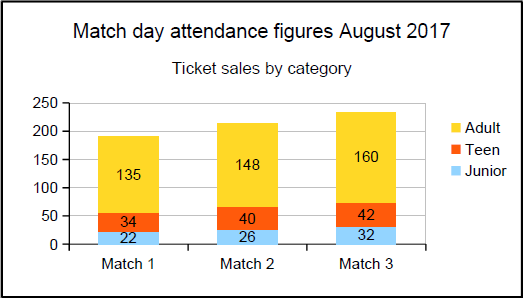
What is the difference in attendance between Match 3 and Match 1?
Incorrect. Hint - Work out the total attendance for Match 1 and then do the same for Match 3.
|
| 7. |
These two dotplots show the results of a memory test for some pupils in Year 7.
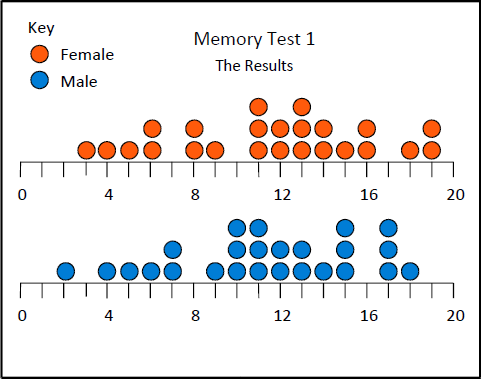
What is the difference between the lowest female score and the highest male score?
Incorrect. Hint - Look at page 14 in Statistics 7a unit.
|
| 8. |
This back to back stem and leaf diagram shows the results of a second memory test for some pupils in Year 7.
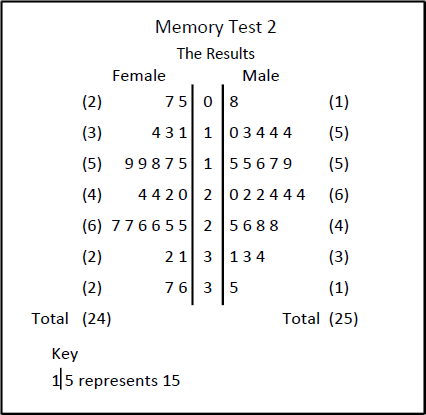
What is the sum of the 3rd highest female score and the 2nd highest male score?
Incorrect. Hint - Look at page 16 in Statistics 7a unit.
|
| 9. |
This graph shows the temperature in a seaside town on a day in September.
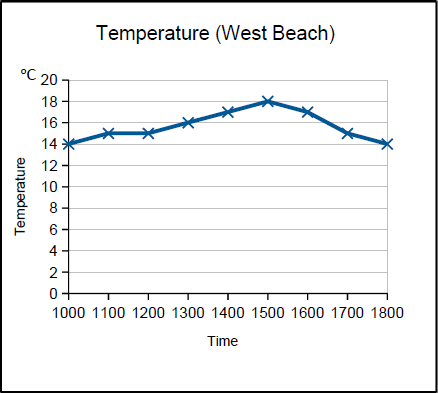
For how many hours was the temperature above 15°C?
Incorrect. Hint - Look at page 4 in Statistics 7a unit.
|
| 10. |
These time series graphs show a household's electricity and water costs over a year.
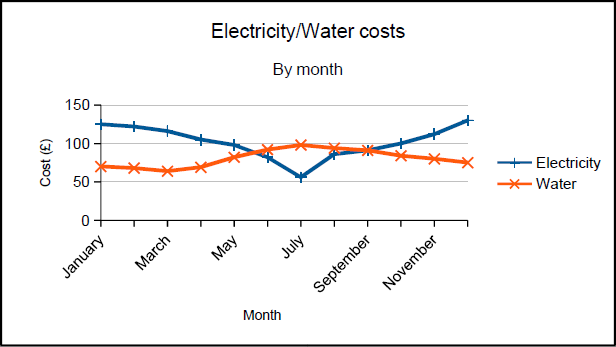
Which of the these statements is false?
Incorrect. Hint - Look at page 5 in Statistics 7a unit.
|
| 11. |
This graph shows the number of hours slept by children of different ages?
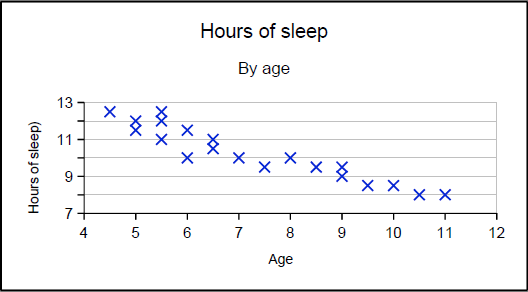
What type of correlation does this show?
|
| 12. |
Which of these statements is an example of positive correlation?
|
| For Questions 13 and 14, you will need to answer them using paper and pencil and then click the 'Check' button to see if you have done them correctly. |
| 13. |
Top Gear is a TV programme aimed at car enthusiasts. Following a change in format and
presenters for Series 23, the viewing figures have dropped dramatically. The figures shown
below are for UK viewers (in millions) and cover the first six episodes of series 23 and the last six
episodes of Series 22. (Data is taken from Wikipedia)
| Episode | 1 | 2 | 3 |
4 | 5 | 6 |
2016 UK viewers
(millions) | 6.42 | 4.06 | 3.44 | 3.22 | 3.57 | 2.62 |
2015 UK viewers
(millions) | 6.14 | 6.24 | 6.04 | 6.15 | 5.84 | 6.92 |
|
| 14. |
In F1 Motor racing, the grid position (starting position) is very important as overtaking
can be difficult. The data below is taken from the German Grand Prix in July 2016.
Starting
position | 2 | 3 | 4 | 1 | 6 | 5 | 8 | 12 | 7 | 9 |
Finishing
position | 1 | 2 | 3 | 4 | 5 | 6 | 7 | 8 | 9 | 10 |
|
| ⮜Back to Year 7 Menu |