Statistics 7b: Mastery Questions |
| Guidance Notes - To answer each question, click on the letter that corresponds to the correct answer. You then need to click the 'Check' button to see if you are correct.
If your answer is incorrect, you will be given a hint on how to get the correct answer. You then need to click the 'Try again' button to attempt the question once more. |
| 1. |
What is the mean of these 5 numbers:
9, 16, 15, 7, 13?
Incorrect. Hint - Look at page 5 in your textbook.
|
| 2. |
The mean age of 4 players in a 5-a-side team is 17.
If the 5th player is 22, what is the
mean age of the whole team?
Incorrect. Hint - Look at page 4 in your textbook.
|
| 3. |
What is the median of these 5 numbers:
9, 16, 15, 7, 13?
Incorrect. Hint - Look at page 6 in your textbook.
|
| 4. |
What is the median of this dataset:
7, 8, 5, 5, 9, 6, 8, 8, 7?
Incorrect. Hint - Look at page 6 in your textbook.
|
| 5. |
What is the mode of this dataset:
7, 8, 5, 5, 9, 6, 8, 8, 7?
Incorrect. Hint - Look at page 6 in your textbook.
|
| 6. |
What is the range of this dataset:
7, 8, 5, 5, 9, 6, 8, 8, 7?
Incorrect. Hint - Look at page 13 in your textbook.
|
| 7. |
Which of these datasets has a mode of 6?
| A | 4, 3, 6, 7, 3 |
B | 3, 4, 3, 6, 6 |
| C | 7, 6, 6, 6, 4 |
D | 3, 4, 6, 9, 9 |
|
|
Incorrect. Hint - Look at page 6 in your textbook.
|
| 8. |
This table shows the summary statistics of groups 7X and 7Y in a recent science assessment.
| Mean | Range |
| 7X | 55 | 45 |
| 7Y | 52 | 30 |
Which group were the more consistent in their scores?
Incorrect. Hint - Look at page 13 in your textbook.
|
| 9. |
Jess chose 5 different positive integers and said that their mean was 8.
What was the highest number Jess could have chosen?
Incorrect. Hint - Look at page 5 in your textbook.
|
| 10. |
Jamie's overall score in Science was 34.
This was the mean of his scores in his Physics, Chemistry and Biology.
If he scored 35 in Physics, 32 in Chemistry, what was his Biology score?
Incorrect. Hint - Look at page 5 in your textbook.
|
| 11. |
The table below shows the number of tries scored by the 12 teams in Premiership Rugby matches over a particular weekend.
| Tries scored | Teams |
| 0 | 1 |
| 1 | 2 |
| 2 | 2 |
| 3 | 4 |
| 4 | 3 |
What was the mode for the number of tries scored?
Incorrect. Hint - Look at page 6 in your textbook.
|
| 12. |
Using the same dataset as Q11, what was the median for the number of tries scored?
Incorrect. Hint - Look at page 6 in your textbook.
|
| 13. |
Using the same dataset as Q11, what was the mean for the number of tries scored?
Incorrect. Hint - Look at page 7 in your textbook.
|
| 14. |
This stem and leaf plot gives the scores of 7Z in a Geography quiz.
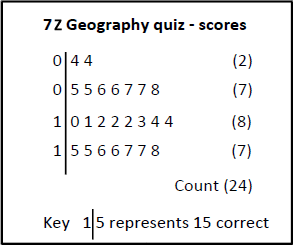
What is the modal score?
Incorrect. Hint - Look at page 6 in your textbook.
|
| 15. |
Using the same dataset as in Q14, what was the median score?
Incorrect. Hint - Look at page 6 in your textbook.
|
| 16. |
Using the same dataset as in Q14, what was the mean score?
Incorrect. Hint - Look at page 5 in your textbook.
|
| ⮜Back to Year 7 Menu |